PROFILER
USER'S
GUIDE
The Portland Group
9150 SW Pioneer Court, Suite H
Wilsonville, Oregon 97070
While every precaution has been taken in the preparation of this document, The
Portland Group, Inc. makes no warranty for the use of its products and assumes
no responsibility for any errors which may appear, or for damages resulting
from the use of the information contained herein. The Portland Group, Inc.
retains the right to make changes to this information at any time, without
notice. The software described in this document is distributed under license
from the Portland Group, Inc. and may be used or copied only in accordance with
the terms of the license agreement. No part of this document may be reproduced
or transmitted in any form or by any means, for any purpose other than the
purchaser's personal use without the express written permission of The Portland
Group.
PGI, pgf77, pgcc, pgprof, and pghpf are trademarks of The Portland Group,
Inc.
Profiler User's Guide
Copyright (c) 1994, 1995 The Portland Group, Inc.
All rights reserved.
PPhone: (503) 682-2806
Fax: (503) 682-2637
e-mail: trs@pgroup.com
This guide describes the pgprof profiler. This guide is part of a set of
books describing the High Performance Fortran compilers and compilation tools
available from The Portland Group, Inc. (PGI). The PGI compilation system
consists of an HPF compiler, an ANSI-
conformant
Fortran 77 compiler as well as an assember and a linker. On some systems the
Fortran 77 compiler, the assembler and the linker are supplied by the hardware
vendor and work seemlessly with the PGI HPF compiler and profiler. You can use
these development tools to create, debug, optimize and profile your software.
To use a compiler with the PGI profiler, you need to be familiar with
the target processor's architecture, the software development process and HPF.
If you need additional information about these topics, refer to the relevant
publications shown in the section, "Related Publications."
Finally, your system needs to be running a properly installed and configured
version of the profiler. For information on installing and configuring the
profiler, refer to the installation instructions. If you did not receive the
installation instructions, contact your system administrator or call your
technical support representative at The Portland Group, Inc.
This guide is divided into the following chapters:
Chapter 1, Introduction to pgprof
- Contains a description of the command line interface required to compile a
program for profiling, and lists information required to use the profiler.
Chapter 2, Graphical User Interface
- The chapter contains a description of the graphical interface to the
pgprof profiler.
Chapter 3, Command Reference
- The chapter contains a list of the pgprof commands and shows how to
use the terminal interface for pgprof.
This guide describes a version of the profiler that operates on a
variety of host systems. Details concerning environment-specific values and
defaults and host-specific features or limitations are presented in the release
notes sent with your software.
This manual uses the following conventions:
- italic
is used for commands, filenames, directories, arguments, options and
for emphasis.
- Constant Width
- [ item1 ]
- square brackets indicate optional items. In this case item1 is
optional.
- { item2 | item 3}
- braces indicate that a selection is required. In this case, you must select
either item2 or item3.
- filename ...
- ellipsis indicate a repetition. Zero or more of the preceding item may
occur. In this example, multiple filenames are allowed.
- BUTTON
- Buttons in the profiler GUI are shown using an outline font.
The following documents contain additional information related to the compilers
and tools available from The Portland Group:
Pghpf User's Guide, describes the HPF compiler.
Pghpf Reference Manual, describes the PGI implementation of theHPF
language.
Pgf77 User's Guide, describes the pgf77 Fortran
compiler.
Pgcc User's Guide, describes the pgcc C compiler.
PgCC User's Guide, describes the pgcc C++
compiler.
The system Release Notes sent with your software contain
late-breaking and host-specific information such as information on how to
install and configure your software on a particular hardware platform.
This document is the user's guide for the pgprof profiler. The profiler
is a tool which analyzes data generated during execution of specially compiled
High Performance Fortran programs. Pgprof allows users to discover which
functions and lines were executed as well as how often they were executed and
how much of the total time they consumed. Pgprof also allows you to
select processor information on multiprocessor systems. The multiprocessor
information allows you to select combined minimum and maximum processor data,
or to select processor data on a processor by processor basis. This information
can be used to identify communications patterns, and identify the portions of a
program that will benefit the most from performance tuning.
Profiling is a three step process:
- Compilation
- Compiler switches cause special profiling calls to be inserted in the code
and data collection libraries to be linked in.
- Execution
- The profiled program is invoked normally, but collects call counts and
timing data during execution. When the program terminates, a profile data file
is generated (pgprof.out ).
- Analysis
- The pgprof tool interprets the pgprof.out file and uses
information from the program symbol table and source files to display the
profile data and associated source files. The profiler supports function level
and line level data collection modes. The next section provides definitions for
these data collection modes.
- Function Level Profiling
Is the strategy of collecting call counts and execution times on a per
function basis.
- Line Level Profiling
Execution counts and times within each function are collected in
addition to function level data. Line Level is somewhat of a
misnomer because the granularity ranges from data for individual statements to
data for large blocks of code, depending on the optimization level. At
optimization level 0, the profiling is truly line level.
- Basic Block
- At optimization levels above 0, code is broken into basic blocks, which are
groups of sequential statements without any conditional or looping controls.
Line level profile data is collected on basic blocks rather than individual
statements at these optimization levels.
- HPF Timer
A statistical method for collecting time information by directly
reading a timer which is being incremented at a known rate on a processor by
processor basis.
- Data Set
- A profile data file and the corresponding program executable are considered
to be a data set.
- Host
- The system on which the pgprof tool executes. This will generally be
the system where source and executable files reside, and where compilation is
performed.
- Target Machine
- The system on which a profiled program runs. This may or may not be the
same system as the host.
- GUI
- Graphical User Interface. A set of windows, and associated menus, buttons,
scrollbars, etc., that can be used to control the profiler and display the
profile data.
The following list shows driver switches which cause profile data collection
calls to be inserted and libraries to be linked in the executable file:
- -Mprof=func
- insert calls to produce a pgprof.out file for function level data.
- -Mprof=lines
- insert calls to produce a pgprof.out file which contains both
function and line level data.
Once a program is compiled for profiling, it needs to be executed. The profiled
program is invoked normally, but while running it collects call counts and/or
time data. When the program terminates, a profile data file called
pgprof.out is generated.
Running the profiler, pgprof allows the profile data produced during the
execution phase to be analyzed and initializes the profiler.
The profiler pgprof is invoked as follows:
% pgprof [options] [-I srcdir] [-o prog] [datafile]
If
invoked without any options or arguments, pgprof looks for the
pgprof.out data file and the program source files in the current
directory. The program executable name, as specified when the program was run,
is usually stored in the profile data file. If all program related activity
occurs in a single directory, pgprof needs no arguments. If present, the
arguments are interpreted as follows:
- Read commands from standard input. On hosts which have a GUI, this
causes pgprof to operate in a non-graphical mode. This is useful if
input is being redirected from a file or if the user is remotely logged in to
the host system.
- Perform coverage analysis. This causes pgprof to interpret
and display profile data based on function and line level code coverage rather
than execution counts and times.
- Include time for functions not compiled for profiling. This option
is only valid for data collected on target machines which support
Sampling. Otherwise it is ignored.
-
Add a directory to the source file search path. Pgprof
will always look for a program source file in the current directory first. The
-I option can be used multiple times to append additional directories to
the search path. Directories will be searched in the order specified. It is
acceptable to leave white space between the -I and the srcdir
arguments.
-
A single datafile name may be specified on the command line.
The datafile may be in standard pgprof.out or System V lprof
format, in which case the default executable name is stored in the datafile, or
it may be in System V mon.out format, in which case the default
executable name is a.out.
-
Use prog as the executable name rather than the
default.
An initialization file named .pgprofrc may be placed in the current
directory. The data in this file will be interpreted as command line arguments,
with any number of arguments per line. A word beginning with # is a comment and
causes the rest of the line to be ignored. A typical use of this file would be
to specify multiple source directories. The .pgprofrc file is read after
the command line arguments have been processed. Any arguments provided on the
invocation line will override conflicting arguments found in the
.pgprofrc file.
This data collection method employs a single timer per processor, which starts
at 0 and is incremented at a fixed rate while the program being profiled is
active on each processor. The profiler's function summary data (minimum,
maximum and per processor) is based on the longest running processor's time to
run a function (as well as the shortest and the selected processor). How the
timer is incremented and at what frequency depends on the target machine. The
timer is read from within the data collection functions and is used to
accumulate COST and TIME values for each function, and TIME values for each
line on a per processor and on a total execution time basis. The line level
data is based on HPF source lines. The function data is also based on HPF
source functions. Times are reported on a preprocessor basis. Times as a
percentage may be greater than 100% for the processor with the maximum running
time for a function, as compared to a processor that runs a function in less
than the maximum time. Data is available for maximum and minimum values over
all processors.
Note, due to the timing mechanism used by the profiler to gather data,
information provided for longer running functions will be more accurate than
for functions that only executee for a short percentage of the timer's
granularity. Refer to the list of Caveats below for more profiler limitations.
-
This is the sum of the differences between the timer value
entering and exiting a function. This includes time spent on behalf of the
current function in all children whether profiled or not.
-
Entering a profiled function pushes it on a time accumulation
stack and leaving it pops it from the stack. Time (including unprofiled
function time) is always accumulated by the function currently on top of the
stack.
-
This is a simple timer difference. It includes all time spent
in and under functions called from within the line whether they are profiled or
not. Line time is equivalent to line cost using this collection scheme.
The
data provided by HPF timer profiling based collection allows you to analyze
relationships between functions and between processors. Since line times
include child times, you can follow high cost trails down to the most expensive
functions and discover how much of that expense is attributable to a particular
call chain. Time spent in library functions can be ascertained by examining
line times in the profiled functions which call them.
Collecting performance data for programs running on high speed processors and
parallel processors is a difficult task. There is no ideal solution. Since
programs running on these processors tend to operate within large internal
caches, external hardware cannot be used to monitor their behavior. The only
other way to collect data is to alter the program itself, which is how this
profiling process works. Unfortunately, it is impossible to do this without
affecting the temporal behavior of the program. Every effort has been made to
strike a balance between intrusion and utility, and to avoid generating
misleading or incomprehensible data. It would, however, be unwise to assume the
data is beyond question.
Many target machines provide a clock resolution of only 20 to 100 ticks per
second. Under these circumstances a function must consume at least a few
seconds of CPU time to generate meaningful line level times.
At higher optimization levels, and especially with highly vectorized code,
significant code reorganization may have occurred within functions. Most line
profilers deal with this problem by disallowing profiling above optimization
level 0. The PGI profiler, pgprof allows line profiling at any
optimization level, and significant effort was expended on associating the line
level data with the source in a rational manner and avoiding unnecessary
intrusion. Despite this effort, the correlation between source and data may at
times appear inconsistent. Compiling at a lower optimization level or examining
the assembly language source may be necessary to interpret the data in these
cases.
The pgprof Graphical User Interface (GUI) is invoked using the command
pgprof. This chapter describes how to use the profiler with the GUI.
There may be minor variations in the GUI from host to host, depending on the
type of monitor available, the settings for various defaults and the window
manager used. Some monitors do not support the color features available with
pgprof. The basic interface across all systems remains the same, as
described in this chapter, with the exception of the differences tied to the
display characteristics and the window manager used.
There are two major advantages provided by the pgprof GUI.
-
The pgprof GUI allows a user to view the program source
for any known function in the line profiler window whether or not line level
profile data is available simply by selecting the function name. Since
interpreting profile data usually involves correlating the program source and
the data, the source interaction provided by the pgprof GUI greatly
reduces the time spent interpreting data. The GUI allows users to easily
compare data on a per processor basis, and identify problem areas of code based
on processor execution time differences for functions or lines.
-
It is often difficult to visualize the relationships between
the various percentages and execution counts. The GUI allows bar graphs to be
displayed which graphically represent these relationships. This makes it much
easier to locate the 'hot spots' while scrolling through the data for a large
program.
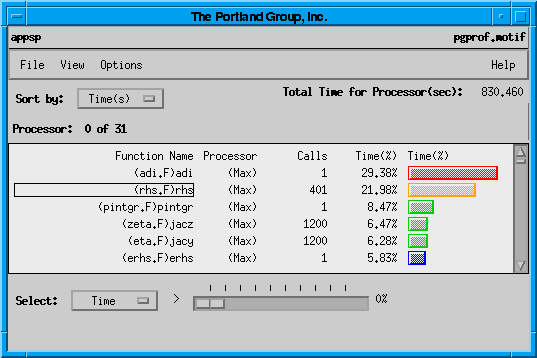
The profiler's main window displays when pgprof is invoked. The figure
on the following page shows an example of a main window for sample profile data
created by running the appsp benchmark.
The profiler widow is divided into five areas: the Title Area, the Menu Bar
area, the Profiler Work area, and the Command and Message areas. The top left
portion of the profiler window's title area shows the name of the routine being
profiled; the right portion lists the name of the profiler command.
The Menu Bar contains the File, View, Options and
Help menus, and below the menu bar is the Sort by button. In
addition, to the right of the Sort by button the total time required
to run the program is displayed. Below the Sort by button, the current
processor is shown in the Processor field.
The profiler work window displays the profile data selected using the
View menu popups and sorted according to the selected sort field.
The bottom of the profiler's main window shows the Command and Message areas
which display informational messages and the Select field. The Select
button provides a selection mechanism that can limit the profile data shown in
the work area to a selected range, under the control of a slider.

- The File menu permits the following actions:
- Load
- Specifies the executable file and the profile data file. The executable
file is the name of the program being profiled. The profile data file is the
name of the file holding the profiler output (normally this is
pgprof.out). Selecting the Ok or Apply buttons loads a
new data set based on the supplied text fields. The Find File
button provides a file chooser dialog box for each field.
-
- The buttons Coverage Mode and Unprofiled Functions allow
you to control whether coverage data is included, if it is available in the
data file, and whether unprofiled functions are listed. Coverage mode lists the
number of calls to a function, or the number of visits to a line in a program.
- Store
- Displays a datafile selection window to specify a file to write out the
current data set. The buttons nolines and notimes specify
whether line level data and time level data are included, respectively. Line
level data may significantly increase the file's size.
- Print
- This cascading menu allows two actions, print to a printer, or print to a
file. The data written is the text for the current display. The Printer popup
allows you to select the printer and the number of copies to print. For
example, if you have two printers at your site, PS1, and PS2, entering PS2 will
print profiler data on PS2. The File popup allows you to select an output file
instead of a printer. Data is written in ASCII.
- Merge
- Specifies a profiler data file that contains additional profile data. This
data is merged into the current display when the OK or the
Apply buttons are selected.
- Directory
- Allows a source file directory to be added to the search path for source
files. The profiler uses this directory to find source files for source
listing. More than one directory can be added using this button multiple times.
Directories cannot be removed from the search list, once they are added.
- Quit
- Exit the program pgprof.
The View menu provides a variety of options for the data shown in the
profiler work window. The View menu controls the organization of data
to show processor information on a system with multiple processors. Data shown
includes one or more of the following: average values, maximum values, minimum
values, or individual processor data. View options display data by number of
calls (coverage) or by execution time, and show HPF communications statistics.
View also controls how information is shown: numerically in columns,
graphically, or both. The View menu has the following options:
- Lines
- Opens a line profiler window for a selected function. If line level data is
not available, a message is shown (to add source files for line level data, use
the File menu's Directory option). The program source for the
specified function will be displayed together with the line level data.
-
- Another way to display line level profiler data is to double click on a
function name shown in the profiler's main window data area.
-
- Refer to section 2.5 "Line Level Data", for more information on the line
level window.
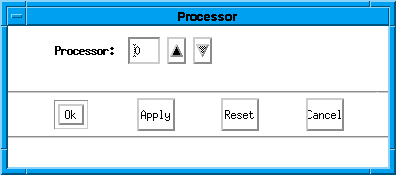
- Processor
- Pops up the processor window. The processor window allows you to enter a
processor number, or to use buttons to increment or decrement the current
processor setting. To accept the current setting, select Ok or
Apply.

-
- Display
- This cascading menus allows you to select characteristics of the profiler
display, including whether data is shown numerically, graphically, or both.
This also lets you clear the current display.
-
- The Display menu options include:
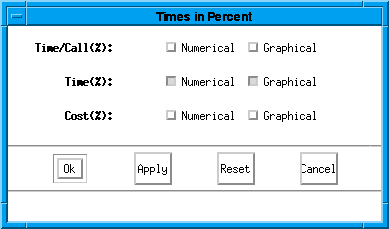
- Times in Percent
- This popup allows you to toggle numerical or graphical data shown for times
as a percentage of total run time.

-
- Times in Seconds
- This popup allows you to toggle numerical or graphical data shown for time
in seconds.
- Counts in Percent
- This popup allows you to toggle numerical or graphical data shown for
execution counts.
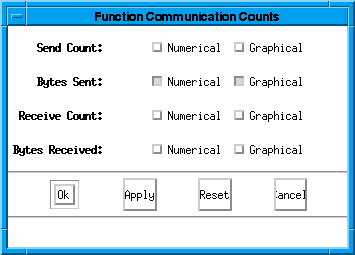
- Communication Counts
- This popup allows you to toggle numerical or graphical display for the
communications data, as shown below.

-
- Communication Percents
- This popup allows you to toggle numerical or graphical display for the
communications data (send count, bytes sent, receive count, bytes received).
- Clear All
- This option clears the display of all currently selected display
choices.
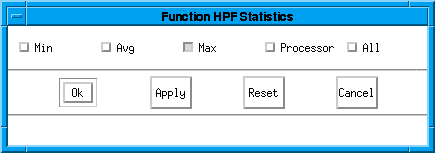
- HPF Statistics
- Allows you to select processor data for the profiler's data window over all
processors, or for the processors with the minimum data values, the average
data values and/or the maximum values.
-

- Printer Options
- This pathname selects the command to use for printing.
- Help Options
- This menu provides two choices, the command name to use for the browser to
display help information with the Help button, and the URL for the
location of the profiler help files.
The Help button brings up the WWW browser and provides online help
(the help information is an online version of this manual).
The About button displays the copyright information and the profiler
version.
The control area's Sort by button allows data to be sorted by the
following ( if data was not collected at runtime for a sort method, the data
may not be available):
- CALLS
- The number of times a routine was called.
- TIME/CALL
- The average time spent in a routine per call, expressed in milliseconds or
as a percentage of the sum of the time per call for all profiled functions. In
simple terms, the profiler tells you how expensive an average call of the
function is relative to an average call of all the other functions.
- TIME
- The total time spent in a function, expressed in seconds or as a percentage
of the total profiled time.
- COST
- The time spent in or under the routine expressed in seconds or as a
percentage of the total profiled time. For example, in a main program the cost
is 100%, since all profiled time is expended in or under the main routine.
- NAME
- This option sorts routines alphanumerically.
- ADDRESS
This option sorts routines by address.
- COVERED
- The number of the lines in a function which were executed. If no line level
data is available, the value will be 100% for covered functions and 0% for
uncovered functions.
The slider in the bottom portion of the screen allows data to be selected and
excluded based on a collection type and and a threshold within a selected range.
The line level window shows line level data and allows some of the display
options that the function window provides. Source lines are listed, along with
the appropriate processor and the data selected.
The interface for non-GUI versions of pgprof is a simple command
language. This command language is available in GUI versions of pgprof
using the -s option. The language is composed of commands and arguments
separated by white space. A pgprof> prompt is issued unless input
is being redirected.
This section describes the pgprof command set. Command names are printed
in bold and may be abbreviated as indicated. Arguments contained in [ and ] are
optional. Separating two or more arguments by | indicates that any one is
acceptable. Argument names in italics are chosen to indicate what kind
of argument is expected. Argument names which are not in italics are
keywords and should be entered as they appear.
- d[isplay] [display options] | all | none
Specify
which MP information is displayed. This includes information on minimum values,
maximum values, average values, or per processor data.
		[no]func_calls          |  [no]1
		[no]func_mp_calls       |  [no]2
		[no]func_time           |  [no]3
		[no]func_calltime       |  [no]4
		[no]func_cost           |  [no]5
		[no]func_process        |  [no]6
		[no]func_send           |  [no]7
		[no]func_receive        |  [no]8
		[no]line_visits         |  [no]9
		[no]line_mp_visits      |  [no]10
		[no]line_time           |  [no]11
		[no]line_process        |  [no]12
		[no]line_send           |  [no]13
		[no]line_receive        |  [no]14
- h[elp] [command]
Provide brief
command synopsis. If the command argument is present only information for that
command will be displayed. The character "?" may be used as an alias for help.
- h[istory] [ size ]
Display the history list,
which stores previous commands in a manner similar to that available with csh
or dbx . The optional size argument specifies the number of lines to store in
the history list.
- li[nes] function [[>]
filename]
Print (display) the line level data together with the source for
the specified function. If the filename argument is present the output will be
placed in the named file. The '>' means redirect output, and is optional.
- lo[ad] [[ program] datafile]
Load a new
dataset. With no arguments reloads the current dataset. A single argument is
interpreted as a new data file. With two arguments, the first is interpreted as
the program and the second as the data file.
- me[rge] datafile
Merge the
profile data from the named datafile into the current loaded dataset. The
datafile must be in standard pgprof.out format, and must have been generated by
the same executable file as the original dataset (no datafiles are modified.)
- pro[cess] processor_num
Specify the processor
number of the data to display.
- pr[int] [[>] filename]
Print (display)
the currently selected function data. If the filename argument is present the
output will be placed in the named file. The '>' means redirect output, and
is optional.
- q[uit]
Exit the profiler.
- sel[ect] coverage |
covered | uncovered | all [[<] cutoff]
This is the coverage mode variant
of the select command. The cutoff value is interpreted as a percentage and is
only applicable to the coverage option. The '<' means less than, and is
optional. The default is coverage < 100%.
- sel[ect] calls | time/call | time |
cost | all [[>] cutoff]
You can choose to display data for a selected
subset of the functions. This command allows you to set the selection key and
establish a cutoff percentage or value. The cutoff value must be a positive
integer, and for time related fields is interpreted as a percentage. The '>'
means greater than, and is optional. The default is time > 1%.
- sh[ell] arg1, arg2, argn...
For a shell using the
given arguments.
- so[rt] [by] calls | time/call | time | cost
| name
(Profile Mode) Function level data is displayed as a sorted list.
This command establishes the basis for sorting. The default is time.
- so[rt] [by] coverage | name
This is the coverage mode variant of the sort command. The default is
coverage, which causes the functions to be sorted based on percentage of lines
covered, in ascending order.
- src[dir] directory
Add the named directory
to the source file search path. This is useful if you neglected to specify
source directories at invocation.
- stat [no]min|[no]avg|[no]max|[no]proc|[no]all]
Set which HPF
fields to display or to not display with the no options.
- st[ore]
datafile [nolines] [notimes]
Store the loaded dataset into datafile in
standard pgprof.out format. The nolines and notimes options exclude line level
and time related data from begin stored. The store command is used to save
merge results, or to convert data from mon.out or lprof datafiles to pgprof.out
format.
- ti[mes] raw | pct
Specify whether time
related values should be displayed as raw numbers or as percentages. The
default is pct. This command does not exist in coverage mode.
- repeat previous command.
- !! [num ]
repeat previous command numbered num in
the history list.
- !! [string ]
repeat previous command containing
the string string from the history list.
-
-
