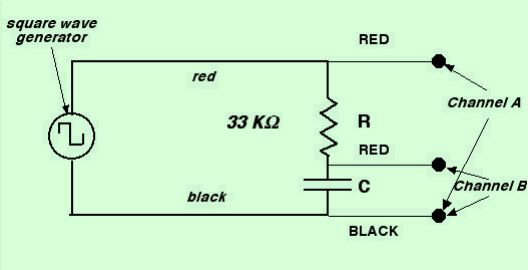
Figure 2.09-3: Square Wave Generator Connected to an R-C Circuit
ELECTROMAGNETIC OSCILLATIONS
1. Open up the Electromagnetic Workbook and fill in the header information.
2. Connect
a series resistor capacitor combination to the HI output of the
square wave generator as in Fig. 2.09-3. Use the black 0.0047μF
capacitor and the 33 KΩ
resistor. Observe the waveform on Channel A, and use a square wave frequency
of 400 Hz. Adjust the generator output to about 1 volt peak-to-peak.
3. Switch to Channel B to monitor the voltage across the capacitor, Vc. Adjust the amplitude knob so that the trace completely fills the screen in the vertical direction. Adjust the time base so that the trace for one cycle completely fills the screen in the horizontal direction. Accurately measure the time for Vc to decrease from Vo to 0.37 Vo. This is a relative measurement, so that if the span from the top to the bottom of the trace is 8 cm, then you would measure the time it takes for the signal to fall to .37 (8 cm) = 3.0 cm. Be sure to check the calibration before recording the data. Record this value as the RC-time-constant in cell D12.
Figure 2.09-3: Square Wave Generator Connected to an R-C Circuit
Figure 2.09-4: Square Wave Generator Connected to an R-L Circuit
6. Connect the square wave generator to the circuit shown in Fig. 2.09-5. With both Vs and VR displayed on the screen, observe the damped LC oscillations for a few frequencies in the 100 to 1000 Hz range. Note that the oscillation frequency is independent of the square wave frequency.
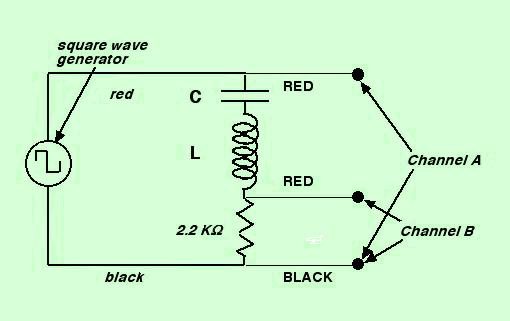
Figure 2.09-5: Square Wave Generator Connected to an R-L-C Circuit
7. For a square wave frequency that gives 4 or 5 oscillations sketch one cycle of the damped oscillations on a piece of scratch paper. Measure the period and frequency of the LC oscillations and record the values in cells E28:29.
8. Replace the square wave generator in Fig. 2.09-5 with a sine wave generator. Use the black 0.0047 μF capacitor in the circuit. Also use the 1 KΩ instead of the 2.2 KΩ. Connect the oscilloscope and generator grounds to the 1 KΩ resistor. Set Vsto about 1 volt-peak-to-peak. With VR displayed on Ch. B of the oscilloscope, vary the frequency of the signal source. Find the frequency setting that makes the amplitude of VR a maximum (resonance), and use the 'scope trace to measure the period and frequency of the input signal. Record the values in cells E33:34.
9. Take data for a graph of the amplitude of VR vs. f, which passes through the resonance frequency. Starting and ending frequencies which make VR ~ 0.05 Vsare suggested. Intermediate points should correspond to approximately equal changes in VR; e.g. VR ~ 0.1 Vs , rather than equal changes in f. Enter the data in the table beginning at cell D37.
Obtain about 14 points for the graph.
Make sure one of these points is at the maximum VR.
(This may not be at one of the "equal interval" values.) Remember that
when the frequency is changed Vs
may have to be readjusted to keep Vs
constant at 1 volt peak-to-peak.