1. Review the 'scope settings suggested in the familiarization
section, and open the Worksheet.
Fill in the header information.
2. Set the CHANNEL A rocker switch to 50 mV/cm. Toggle the
AC/DC switch so that AC is displayed. Connect the cable that has
a red and black connector to channel A input. First grab
the metal end of the black connector and observe the oscilloscope trace.
Is there any change? Next, grab the metal end of the red connector and observe
the trace. See if the effect is the same for each student.
The lead that produced no effect when touched is the ground lead.
Was it black? Try holding the red connector and shuffling your feet.
3. Switch the CHANNEL A rocker switch to the
5-volts/cm setting; make sure VAR is in the calibrated position,
that is, rotated fully clockwise to its detent position.
4. Set TIMEBASE (TB) rocker switch to 5 msec/cm;
make certain VAR is fully clockwise in its detent position.
5. Connect the input cable to the two red banana jacks on the
transformer box. Close both switches ("up" is on).
Plug the cord into an ac outlet. Adjust the
trigger level control and/or the trace position controls until the trace
is stationary and well centered on the 'scope face. This trace is the replica
of the ac voltage that appears at the 110 V outlet. The voltage
is reduced in amplitude because it comes from the secondary of a step down
transformer.
6. Measure and record the peak-to-peak amplitude and period of
the waveform you observe by using the following procedures.
Amplitude: Determine the vertical distance from peak
to peak on the waveform in cm (the screen scale is laid off in
cm as the major division). Multiply the distance in cm d,
by the factor S, on the A display, to obtain the p-p
amplitude Ap-p, in volts.
Record these data in cells E12:E14. For example, if you measure
d = 5.2 cm, and have an S = 5 V/cm reading, then
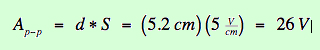 .
.
Another term commonly applied to the strength of a sinusoidal waveform
like this one is the Amplitude A.
The amplitude is simply one-half of the peak-to-peak amplitude. Also record
the amplitude A (in volts) in cell E19 on the data sheet.
Period: The period T is the time it takes the signal to
repeat itself. The horizontal distance h from one point on the
waveform to its next repetition is related to the period as follows.
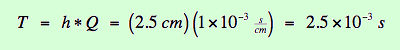
Take the distance h in cm and multiply by the factor Q,
on the TIMEBASE display to get the period. Record these data
in cells E15:E17. For example, if h = 2.5 cm, and the
TIMEBASE display factor Q = 1 ms/cm, then
Another related quantity is the wave frequency f. By definition,
f = 1 / T. So in the above example we have:
f = 1 / (2.5 x 10⁻³ s)
= 4.0 x 10+2 hertz.
Compute and record the frequency of the ac power waveform you have
observed, and record the values in cell E21.
7. Unplug the transformer board and observe what happens to the
trace. Remove the leads from the circuit.
1. Connect the output of the Function Generator across
the two 33 kΩ (orange-orange-orange) series resistors on the
breadboard. Set the amplitude
control at about 9 o'clock. Depress the 1 kHz range button. Turn
the frequency knob until the readout indicates 1.00 kHz. The frequency
knob should be pushed IN to eliminate the SWEEP function.
All the other buttons should be pushed IN.
2. Connect the channel A 'scope input directly
across the string of resistors
(see Fig. 2.07-3 below) and set the A/B button to CH A.
The ALT-CHOP button can be in either ALT or CHOP
display position, whichever gives the better looking trace pattern.
Turn on the Function Generator and make appropriate adjustments
to accurately measure and record the peak to peak signal Ap-p
and the period T, of the generator. Record these values in
cells C41 and F41.
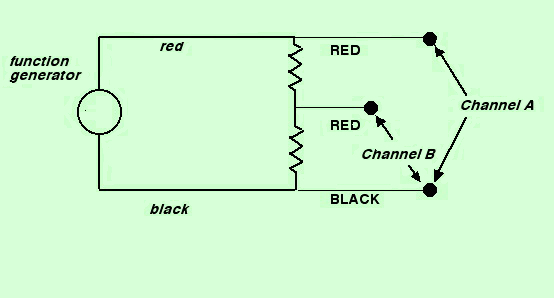
Figure 7-3: Test Circuit with Two Series Resistors
3. Next, connect the channel B input of the 'scope
across the one resistor
that is connected to the black banana jack. Set the A/B toggle
button to the CH B position, and adjust to make accurate measurements.
Measure Ap-p and T for this waveform, and record
the values in cells C42 and F42.
4. Set the A/B button to the A B display (both)
position to compare
the two waveforms. Notice that they reach their peak values and their
valley values at the same point along the horizontal (time) scale.
We say that two such waveforms are in phase with each other. The
voltage signal on channel B is in fact proportional to the ac current
I that is flowing in the circuit because it is the voltage measured
across the resistor. Use Ohm's law to calculate the peak to peak value of
the current as follows:
Ip-p = Vp-p / R
Record the result in cell E44. In an all-resistive circuit,
the current will always be in phase with the applied voltage.
5. Keep the generator frequency at 1 kHz.
Connect the output directly
across the series resistor-capacitor string. Again monitor the voltage
waveform on channel A and the current waveform on channel B
by connecting the 'scope as shown in Fig. 7-4.
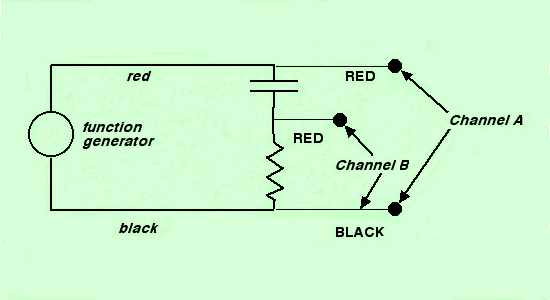
Figure 7-4: Connections to a Series R-C Circuit
Repeat the measurements of voltage and current amplitude as carried
out in steps 2 to 4 above. There is no need to
measure the period because it remains the same. Record the necessary
data in the table beginning at cell A47.
The two waveforms are now shifted relative to each other.
This result is easily seen if you use the position
controls to line up the peaks of the two waveforms at the same vertical
level. We say that there is a phase shift between the two waveforms.
Measure and record in cell D59 the horizontal distance
X between adjacent peaks on the two signals
in cm. Also measure the horizontal distance h for one full
period of either waveform. Record the value in cell D63. You can
boost the Function Generator amplitude as necessary to make an accurate
measurement. Compute the ratio X/h, and find the phase angle difference,
given by
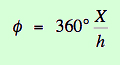
6. Record this value on the Worksheet in cell D67.