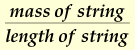
1. Calculate the mass per unit length of the cord μ, by finding the ratio
 .
Enter the results in cell D13.
.
Enter the results in cell D13.
ANALYSIS
1. Calculate the mass per unit length of the cord μ,
by finding the ratio
.
Enter the results in cell D13.
2. Multiply the mass in cells B18:21 by the acceleration due to gravity, g = 9.8 m/s2, and enter the results in the second column under Tension in cells C18:21.
3. From the distance between first and last nodes L, and the number of loops (antinodes) N, calculate wavelength for each individual standing wave pattern using the relation:
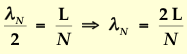
A separate column is provided in the Data Table for the wavelength λN. Enter the values in cells E18:E21.
4. Calculate the square of the wavelength
![]() ,
for each pattern, and enter in cells F18:F21.
,
for each pattern, and enter in cells F18:F21.
5. Use the relation v = f λ to calculate the speed v, and speed squared v2, for each loop pattern. Enter the results in cells G18:H21.
6. Make a graph of the speed squared versus tension. Draw the
best straight line through the data. If you use the Chart Maker , first
select the Tension column, then hold down the "apple" key and select
the speed squared column to set up the plot. From equation (2),
note that  ,
so that the Slope S, of this line is the reciprocal of the linear
mass density of the string, μ.
Enter the value of the Slope in cell D25. Compute the reciprocal
of the Slope, 1/S, and enter the value in cell D27.
,
so that the Slope S, of this line is the reciprocal of the linear
mass density of the string, μ.
Enter the value of the Slope in cell D25. Compute the reciprocal
of the Slope, 1/S, and enter the value in cell D27.
7. Calculate the percentage difference between the reciprocal slope and the measured linear mass density μ from cell D13. Enter the result in cell D29.
8. Make a plot of the squared wavelength λ2, vs. the tension T, in the string and draw the best straight line through the data. From equation (3), note that the slope of this line is
 .
.
Record the slope of this line, S' in cell D33.
9. The frequency of the waves can be determined by solving the above relation for the frequency:

Use the slope S' and calculated mass per unit length μ to find the calculated frequency. Enter the result in cell D35.
10. Compare the above result to the actual frequency that is recorded in cell G12. Determine the percentage error and enter the value in cell D37.
11. Attach your graphs to the bottom of the completed
Worksheet to your lab report.