Return to the ULI Temperature link window.
Time Constant Determination:
1. The first task is to establish the time constants for the two
thermometers as they cooled down. Choose menu ANALYZE....Examine so
that the selection is checked. The graph cursor becomes a circle. Locate
the cursor as close as you can get to the very beginning of the cool-down.
It should show the same temperature and time reading for each probe.
Record the time and starting temperature for both probes on the
Worksheet in cells E15:E16 and F15:F16, respectively.
2. Use the spreadsheet to determine 37% of the difference
between the starting temperature and room temperature added to the
room temperature for probes #1 and #2 in cells E18 and
F18, respectively. These are the values of the time constants for
each of the respective cool-downs.
HINT:
Since the starting temperature for probe #1 is in cell E16 and room
temperature is entered in cell F9, in cell E18 enter
"= .37 * (E16 - $F$9) + $F$9".
In cell F18, enter
"= .37 * (F16 - $F$9) + $F$9".
This formula takes 37% of the difference between To and
Tr and adds Tr to the total.
3. Return to the LoggerPro window and move the cross-hair
cursor until the temperature value on Temp 1 readout is equal
to the 37% of the value in cell
E18. Observe the time value on the read-out and
record the elapsed time from the start of the cool-down in cell E19.
4. Repeat the procedure above for the temperature value on
Temp 2. When its read-out is equal to the 37% value in cell
F18 observe the elapsed time from the start of the cool-down for this
Probe and record it in cell F19.
5. Answer Questions 1 and 2 on the Worksheet.
Curve Fitting:
6. On the LoggerPro window drag the cursor with the mouse
button down to select the data covering the last 200 seconds or so of
the cool-down.
7. Choose the menu ANALYZE....Curve Fit. You
should get a dialog box like the one shown below:
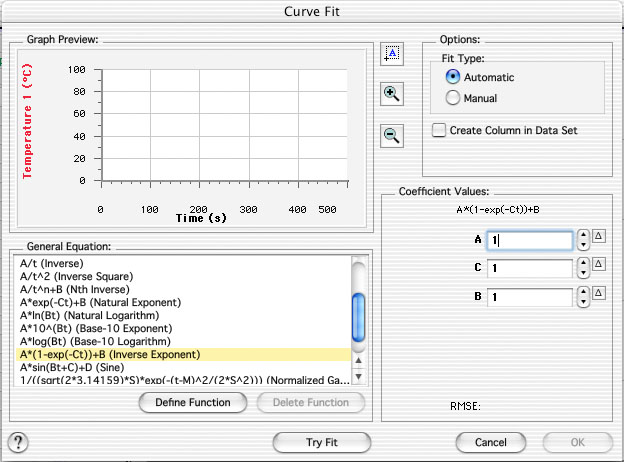
Make sure that the "Inverse Exponential" choice is selected
and that the right-hand box says "Temp 1". Then hit Try Fit.
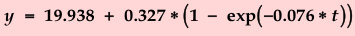
A fitting curve will be drawn through the probe #1
data. Record the fitting formula as it appears above the graph on
the Worksheet in the space indicated. You should have something
that looks like the following:
Repeat for Temp 2 by changing the selection in the upper right-hand
corner of the dialog box to "Temp 2". Record the fitting formula on
the Worksheet in the space indicated.
8. The important number in the fitting formula is the number that
multiplies the variable t in the argument (parentheses) of the
exp function. Record these coefficients for probes #1 and
#2 in cells E50 and F50, respectively. Since they are a
measure of the thermal conduction in each case, determine what the ratio of
thermal conduction is without and with the insulating sleeve. Record this
ratio in cell G52.
9. Answer Questions 3 and 4 on the Worksheet.
10. Make sure you complete the Worksheet, print it out and
turn it in to your instructor.