Activity I. Collision along a Straight Line
1. Open
the Worksheet
and fill in the header information.
2. Open the linear collision clip.
Video Analysis
3. Click on the Enable Video Analysis icon
 at the lower right-hand corner of the video frame. The next step is to
calibrate the length scale in the video. On the tab menu that appears at
the right margin of the video frame, click on the Set Scale icon
at the lower right-hand corner of the video frame. The next step is to
calibrate the length scale in the video. On the tab menu that appears at
the right margin of the video frame, click on the Set Scale icon
 .
.
4. At the left edge of the scene, use the mouse to select the dark
dot at the center of the vertical aluminum band. Go to the right side of
the scene and select the dark dot at the center of the vertical
aluminum band. A green line should appear to connect the two dots.
In the dialog box that appears, enter a value of 1.192 m in the
Distance box and hit OK.
5. Use the rectangular VCR button to step the clip forward past the
introduction captions to the point where the pucks just start to move. Stop at
the first frame before the motion begins. You can use the frame forward
 and frame backward
 buttons to find this point precisely.
6. Click on the Sync Movie icon
 and in the dialog box, set the Graph Time to 0 s. Hit OK.
7. Click on the Add Point icon
 .
Place the cursor at the center of the top disk and click on it. The video
will automatically step to the next frame.
.
Place the cursor at the center of the top disk and click on it. The video
will automatically step to the next frame.
8. Continue this way frame-by-frame until the last frame is
reached.
9. Go back through the video clip with the slider and stop at the
exact frame where the motion begins again. Click on the
Set Active Point icon
 .
Place the cursor at the center of the lower disk and click on it.The
video will automatically step to the next frame.
.
Place the cursor at the center of the lower disk and click on it.The
video will automatically step to the next frame.
10. Continue this way frame-by-frame until the last frame is
reached.
11. When you have completed recording the disk positions at the
last frame, select the video, then Copy and Paste it on to the
Worksheet where indicated.
Calculations
Next you will set up some calculated values for the x- and y-components of
the momentum, the total momentum and the energy. These calculated values will
help you to determine if momentum and energy are conserved.
12. In the Logger Pro window, go
to the menu Data…New Calculated column.
13. Select the Column Definition tab. In the dialog box,
type the following:
a. Name: x-momentum
b. Short Name: Px
c. Units: kg-m/s
d. Equation: 0.0321* ("X-Velocity" + "X-Velocity2")
Select the velocities above from the pull-down Variables menu. The mass
of both disks is the same at 0.0321 kg. The equation as it would
appear in standard form is:
Px = mv1x + mv2x.
14. Repeat step 12, then select the
Column Definition tab. In the dialog box, type the following:
a. Name: y-momentum
b. Short Name: Py
c. Units: kg-m/s
d. Equation: 0.0321* ("Y-Velocity" + "Y-Velocity2")
Select the velocities above from the pull-down Variables menu.
The equation as it would appear in standard form is:
Py = mv1y + mv2y.
15. Repeat step 12, then select the
Column Definition tab. In the dialog box, type the following:
a. Name: total momentum
b. Short Name: Ptot
c. Units: kg-m/s
d. Equation: sqrt("x-momentum"^2 + "y-momentum"^2)
Select the sqrt function from the pull-down Function menu
and select the momenta above from the pull-down Variables menu.
The equation as it would appear in standard form is:
Ptot = (Px2 +
Py2)1/2.
Graphs
In order to display the data calculated above, you will insert two more
graphs in addition to the one already present.
16. Under the Insert menu, select Graph. Resize the
graph window to match the other one already present. Double click on the new
graph window. In the dialog, select the Graph Options tab and click on
the Legend button. Type "velocity vs. time" in the Title box.
Select the Axes Options tab. Under Y-Axis Columns--VideoAnalysis,
select the following: X Velocity, Y Velocity, X Velocity 2, and Y Velocity
2. Deselect X, Y, X2 and Y2 if checked. Under the X-Axis,
select time if it is not already done. The plot will now display the
two disks' velocities before and after the collision.
17. Under the Insert menu, select Graph. Double
click on the new graph to get the Graph Options dialog. Select the
Graph Options tab and click on the Legend button. Type
"momentum vs. time" in the Title box. Select the Axes Options
tab. Under Y-Axis Columns, select the following: x-momentum, y-momentum
and total momentum. Deselect any other button that might be indicated.
Select the Autoscale from 0 button. The plot will now display the
x- and y-components of the total momentum along with the magnitude of the
total momentum before and after the collision.
18. Under the Page menu, select Auto Arrange. The
video, table and three graph windows should be neatly arranged.
Data Analysis
Conservation of Momentum can be applied as long as there are no external
forces acting on the system. This usually means that we must consider only the
data collected just before and just after the collision. You will
next "zero" in on the collision to get the most accurate data on the momentum
and the energy.
19. On the velocity plot, determine the time when the collision
took place. With the mouse select the time interval that runs from about 0.2 s
before the collision to about 0.2 s after the collision.
Make sure the entire vertical span is selected and appears in the darker color.
Hit the Zoom In button
 .
The plot will adjust to cover only this interval.
.
The plot will adjust to cover only this interval.
20. Use the cursor to select only the data before the
collision occurs and the velocities begin to change. Under the Analyze
menu, select Linear Fit. In the dialog box, make sure that all four
data plots are selected.
21. Four data boxes will appear on the plot, one for each set of
data. Double click on each box and select Show Uncertainty for
each one. Record the Y-Intercept and its uncertainty for the
following quantities:
 (X-velocity),
 (X-velocity2),
 (Y-velocity),
and
(Y-velocity),
and  (Y-velocity2)
in cells C33:D36.
(Y-velocity2)
in cells C33:D36.
22. Calculate the total kinetic energy of the system
before the collision as
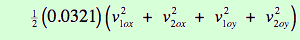 and enter the result in cell C38.
23. Use the cursor to select only the data after the
collision occurs and the velocities begin to change. Under the
Analyze menu, select Linear Fit. In the dialog box,
make sure that all four data plots are selected.
24. Four data boxes will appear on the plot, one for each set of
data. Double click on each box and select Show Uncertainty for each one.
Record the Y-Intercept and the uncertainty for the following quantities:
 (X-velocity),
 (X-velocity2),
 (Y-velocity),
and
(Y-velocity),
and  (Y-velocity2)
in cells C40:D43.
(Y-velocity2)
in cells C40:D43.
25. Calculate the total kinetic energy of the system
after the collision as
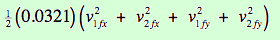 and enter the result in cell C45.
26. Repeat the zoom-in process on the other two plots over the
same interval.
27. Select the momentum (middle) plot. Under the
Analyze menu, select Linear Fit. In the dialog box,
make sure that all three plots are selected.
28. Three data boxes will appear on the plot, one for each set of
data. Double click on each box and select Show Uncertainty for each
one. Record the y-intercept and the uncertainty in the y-intercept for the
x-momentum, the y-momentum and the total momentum in cells C49:D53.
Activity II. Collision at an Angle: Equal Masses
1. Open (only) one of the following clips and repeat the
procedures from Activity I as listed below:
Clip 1
Clip 2
Clip 3
Clip 4
Clip 5
Clip 6
Video Analysis
2. Repeat steps 3 to 11 in Activity I above.
Calculations
3. Repeat steps 12 to 15 in Activity I above.
Graphs
4. Repeat steps 16 to 18 in Activity I above.
Data Analysis
5. Repeat steps 19 to 28 in Activity I above.
Use cells C81:D91 for the velocity data, cells C86 and C93
for the energy calculations, and cells C97:D101 for the momentum data.
Activity III. Collision at an Angle: Unequal Masses
In this activity, the colliding disks are of different mass. The smaller
one is always 0.0321 kg and the larger one is always 0.0817 kg.
1. Open (only) one of the following clips and repeat the
procedures from Acitivity I as listed below:
Clip7
Clip 8
Clip 9
Clip 10
Clip 11
Clip 12
Clip 13
Clip 14
Clip 15
Video Analysis
2. Repeat steps 3 to 11 in Activity I above.
Calculations
Because of the different masses the calculation steps are different from
those in Activity I.
3. In the Logger Pro window, go to the menu
Data…New Calculated Column.
4. Select the Column Definition tab. Determine which disk
is the larger one. If it is the upper disk then it will have the 0.0817 kg
mass and will be the first object. If it is the stationary
disk, then it will be object 2. For example, if the bigger disk is
the moving disk, in the dialog box, you would type the following:
a. Name: x-momentum
b. Short Name: Px
c. Units: kg-m/s
d. Equation: 0.0817* "X Velocity" + 0.0321 * "X Velocity 2"
Select the velocities above from the pull-down Variables menu.
If the larger disk is stationary, then interchange 0.0817 kg and
0.0321 kg. The equation as it would appear in standard form is:
Px
= m1v1x + m2v2x.
5. Go to the Data/New Calculated Column. Determine
which disk is the larger one. If it is the upper disk then it will have the
0.0817 kg mass and will be the first object. If it
is the stationary disk, then it will be object 2. For example, if
the bigger disk is the moving disk, in the dialog box, you would type the
following:
a. Name: y-momentum
b. Short Name: Py
c. Units: kg-m/s
d. Equation: 0.0817* "X Velocity" + 0.0321 * "X Velocity 2"
Select the velocities above from the pull-down Variables menu.
If the larger disk is stationary, then interchange 0.0817 kg and
0.0321 kg. The equation as it would appear in standard form is:
Py
= m1v1y + m2v2y.
6. Go to the menu Data/New Calculated Column. In the dialog
box, type the following:
a. Name: total momentum
b. Short Name: Ptot
c. Units: kg-m/s
d. Equation: sqrt("x-momentum"^2 + "y-momentum"^2)
Select the sqrt function from the pull-down Function menu and
select the momenta from the pull-down Variables menu.
The equation as it would appear in standard form is:
Ptot
= (Px2 + Py2)1/2.
Data Analysis
7. Repeat steps 19 to 28 in Activity I above.
Use cells C127:D137 for the velocity data, cells C132 and
C139 for the energy calculations, and cells C143:D147 for the
momentum data.