 shows
that it is proportional to the square root of the length L.
We normally prefer to make a plot that we expect to result in a straight
line. In order to do this, notice what happens when you square both sides
of the above equation:
shows
that it is proportional to the square root of the length L.
We normally prefer to make a plot that we expect to result in a straight
line. In order to do this, notice what happens when you square both sides
of the above equation:
ANALYSIS
1. Calculate
the percentage change in the Period from the beginning to the end of each
run. Take the difference between the first and last Period data in cells
B16:E16.
Divide the difference by the last value to obtain the percent change and
enter the results in cells B19:E19.
2. Copy the value of the Length and Average Period in the Data Table at cells C23:D26 on the Worksheet.
3. Determine the frequency of the pendulum for each different length. Put these results in the Data Table in cells E23:E26.
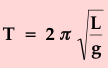
4. GRAPHING: The formula for the period:
shows
that it is proportional to the square root of the length L.
We normally prefer to make a plot that we expect to result in a straight
line. In order to do this, notice what happens when you square both sides
of the above equation:
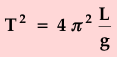
This relation says that if we plot the square of the Period T2, vs. the length L, a straight line should be produced with a Slope of 4π2/g.
Calculate the square of the Period for each run, and enter the values in cells F23:F26 on the Worksheet.
5. Use the Chart Maker to plot the square of the Period vs. the Length of the pendulum. Select the data in columns C and F. Select the data in column C first, and then press the command key when selecting column F -- this allows you to plot two separated columns of data.
Select the x-y scatter icon
![]() from the top Toolbar.
from the top Toolbar.
Click on the chart itself.
Click on the legend and hit Delete.
From the View menu, select the Formatting Palette if it is not already present.
Select Chart Title from the Title pull-down menu and fill it in.
Next select titles for the Horizontal and Vertical axes and fill them in.
Use the mouse to size the chart and to locate it from cells A46:F64.
6. Click on any one of the data points.
Choose Chart...Add Trendline from the menu.
Under the Options tab, choose Display equation on chart. The equation of the best straight line fit to the data will appear on the chart.
7. Record the Slope of the line and record the value in cell C28.
8. ACCELERATION DUE TO GRAVITY: According to the above equation, the Slope of a plot of T2 vs. L is 4π2/g. This means that the acceleration due to gravity, g, is given by:

Calculate g from the Slope, and enter the value in cell C30. Using the known value of g = 9.80 m/s2, determine the percentage error and enter in cell C32 on the Worksheet.
9. Answer Question 1 on the Worksheet.
10. Print out the completed Worksheet and submit it to your
lab instructor.