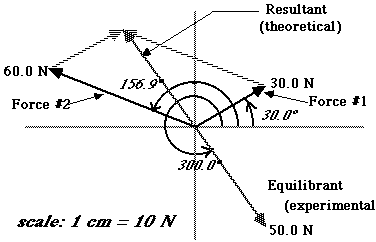
Figure 6-1: Graphical Representation of Forces
On the force table, equilibrium is indicated by the ring to which the
strings are attached. At equilibrium, this ring is centered on the pin
at the center of the table. After getting apparent equilibrium, remove
the pin and gently move the ring a short distance from the center position
and observe whether the ring returns to the exact position as it should.
This procedure will help to make certain that the forces are due to the
weights (masses) and not due to friction in the pulleys. Do not tie
any additional loops or knots in the strings.
Ý
2. Place a second pulley at* degrees, and suspend a total weight of 1.47 N (150 g) over this pulley. This will be called force B.
* YOUR INSTRUCTOR WILL PROVIDE YOU WITH THE ANGLES TO BE USED HERE
3. By trial and error, determine the position of the third pulley and the force in newtons necessary to exactly balance the other two forces. This third force is the EQUILIBRANT. It is opposite in direction and equal in magnitude to the RESULTANT of the first two forces.
4. Open up the Force Table Workbook link and fill out the header information, and enter the forces used and their angles in the PROCEDURE 1 area in the DATA Table.
5. Open up the Force Table Graphics Sheet link. Use the STRAIGHT LINE graphics tool to draw a vector to represent FORCE A. Since it is about 3N, a convenient scale is to let 1N = 2cm on the drawing. The appropriate vector arrow can be drawn by doing the following:
* Select the STRAIGHT LINE tool.
* Holding the SHIFT KEY down, hold the mouse button down at a starting point and continue to the end 6cm away.
You should get a HORIZONTAL arrow that is 6cm (3N) long.
* Make sure that LAYOUT....SHOW SIZE is selected. Click the mouse on Force A and you should see a display of numbers at the bottom of the window. These readouts are: horizontal component, vertical component, angle measured from the +x-axis, and total magnitude.
* With the vector still selected (sizing boxes at each end) choose ARRANGE...ROTATE from the menu.
* Drag the TIP of the Force A until the angle reading is equal to what you had in the measurement set up (cell C10).
* Slide the vector down so that its tail is located at the RED RESOLUTION ORIGIN.
BE CAREFUL NOT TO GRAB IT WITH THE SIZING BOXES!
You may need to practice a few times to master the procedure.
6. Do exactly the same thing with FORCE B, which is nearly 1.5N or 3cm long on the scale.
7. At this point, you should have 2 forces with their tails on the RED origin. Select FORCE B with the mouse. Select the menu EDIT....DUPLICATE. This operation produces a duplicate of the Force B vector directly on top of it. Grab it with the mouse (being careful NOT to grab on the sizing boxes) and slide it until its TAIL coincides with the TIP of the FORCE A vector. This is the process of vector addition and you can now find the RESULTANT (sum) of the two forces.
8. Draw the RESULTANT with the STRAIGHT LINE tool. Do NOT use the SHIFT KEYÝ in this process! It is a vector that begins at the ORIGIN and ends at the TIP of the transferred FORCE B vector.
9. Click and Hold on the RESULTANT. Observe and record the magnitude and angle of this force on the Force Table Workbook where indicated in ANALYSIS A.
10. Compare the magnitude of the RESULTANT with the value measured for the EQUILIBRANT. Make sure you convert from the drawing scale back to Newtons! Find the PERCENTAGE DIFFERENCE between the two values.
11. Return to the Force Table Graphics Sheet and CLICK and HOLD on FORCE A. Record its x- and y-components on the Force Table Workbook in ANALYSIS B. BE CAREFUL about the algebraic signs of the components-the Graphics Sheet always gives a positive value. Repeat for FORCE B.
12. Add up the components separately to obtain the x-component and the y-component of the RESULTANT. HINT: you can let the spreadsheet do the work by entering in cell E18 the following: "= C18 + D18"; and in cell E19: "= C19 + D19".
13. From the two components, calculate the MAGNITUDE of the RESULTANT and enter its value in the Force Table Workbook. HINT: In cell E21 enter: "SQRT(E18^2 + E19^2)". This formula simply squares the components, adds them and takes the square root.
14. Compare the MAGNITUDE that you have computed with the MAGNITUDE of the EQUILIBRANT. Find the PERCENTAGE ERROR and enter it into the spreadsheet.
15. Return to the Force Table Graphics Sheet , and choose under EDIT.....SELECT ALL. Select EDIT....COPY and EDIT....PASTE at cell A24 on the Worksheet. Resize as necessary.
PROCEDURE 2
1. Repeat the procedure and calculations of PROCEDURE 1 except to place the first pulley at * and the second pulley at * . The Procedure 2 Section of the Force Table Workbook is set up in a similar way.
2. Return to the Force Table Graphics Sheet , and choose under EDIT.....SELECT ALL. Select EDIT....COPY and EDIT....PASTE at cell A56 on the Worksheet. Resize as necessary.
PROCEDURE 3
1. In this procedure, you are to determine the equilibrant of three forces by experiment. Place the first pulley at 0.0o and suspend a total weight from it of 0.685 N (70 g). Place a second pulley at * adegrees, and suspend a total weight of 1.47 N (150 g) over it. Place a third pulley at * adegrees, and suspend a total weight of 1.96 N (200 g) over it. By trial and error, determine the equilibrant.
2. Repeat the same procedures as above, except now you will have three forces to find the resultant for. As before find the MAGNITUDE of the RESULTANT by using the SIZE data on the Force Table Graphics Sheet . Compare with the measured MAGNITUDE of the EQUILIBRANT and compute the PERCENTAGE DIFFERENCE. All of these results are to be recorded in the Force Table Workbook as indicated there.
3. Using the drawing in the Force Table Graphics Sheet, determine the values of the components of all three forces and record them in the Force Table Workbook. Perform the calculation to find the components of the RESULTANT and from these values, the MAGNITUDE of the RESULTANT. Use the spreadsheet functions whenever feasible. Compare with the MAGNITUDE of the EQUILIBRANT, and compute the PERCENTAGE ERROR.
4. Return to the Force Table Graphics Sheet , and choose under EDIT.....SELECT ALL. Select EDIT....COPY and EDIT....PASTE at cell A89 on the Force Table Workbook. Resize as necessary.
5. PRINT the Force Table Workbook and turn it in to your instructor.