As you have seen on the previous pages, as the amount of light pollution gets larger, our ability to see stars and galaxies grows smaller. While that may not seem like such a big problem to amateur astronomers and just star gazers, to professional astronomers this is a big issue. We will look at three areas from the animation, a big bright star, a smaller, dimmer star, and an H-II region that is located in of of the arms in the galaxy, to show just how big of an impact light pollution can have on astronomical data.
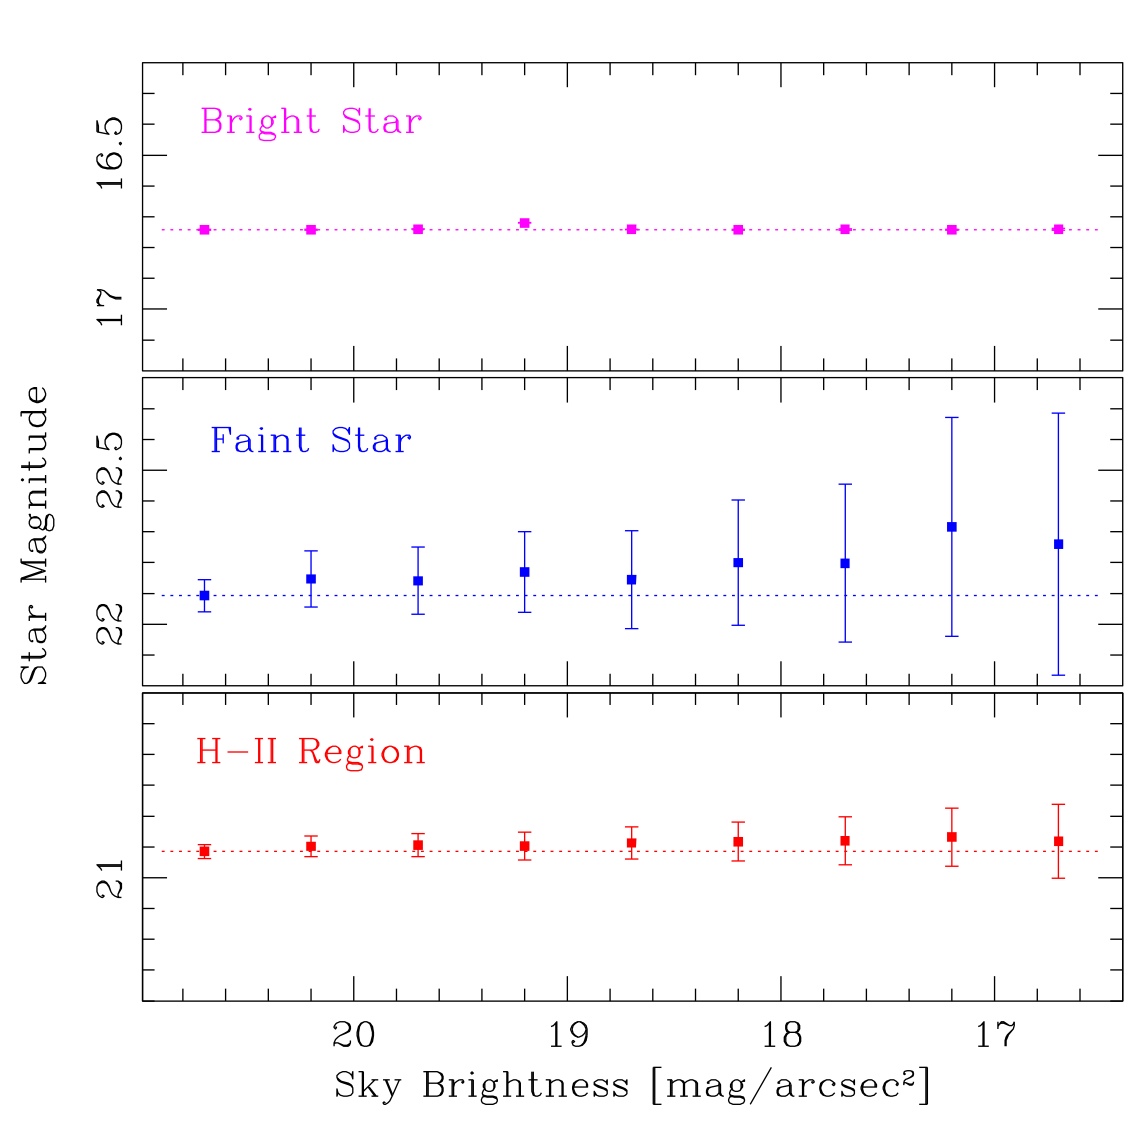
The line going across each graph is to show where the original plot (x=20.7) was so that it is easier to see the difference in visibility from the beginning to the end. The vertical bar going through each of the points is an error bar, showing how accurate the measurement is. A small error bar means that the data is mostly correct, while a large error bar means something is corrupting the data, or that we do not yet have the technology to make an accurate measurement. The error bars in the graph shows how much light pollution corrupts the data taken from stars. Each box is one magnitude in height. The animation that corresponds to this graph is the second one on the main page, taking .5 intervals starting at 20.7 mag/arcsec2
As we look at this graph, we see that the bright star does not change all that much throughout the animation, the H-II region changes slightly with some error in the data, while the dim star changes a lot with a lot of error in the data. What this means is astronomers who want to take data on stars, as well as anything else that we can see in the night sky, can't be sure there data is correct if there is a lot of light pollution in that area, especially for dimmer stars.