We are using the BGSU 0.5-meter telescope and CCD camera to monitor the brightness and color changes over time of a number of variable stars. Currently, we are focusing on a specific class of variables called RR Lyrae stars. Our goal is to determine the intrinsic colors of these stars, so that we may use them as tools for measuring the amount of reddening and absorption due to interstellar dust between us and these stars. Ultimately, this will help us measure more accurate distances to old populations of stars like globular clusters, the Galactic Center, and other galaxies within the Local Group. The following is a more detailed discussion of why and how we are doing this.
The REU students at Cerro Tololo Inter-American Observatory (Chile) have contributed to this effort by observing lots of RR Lyrae stars in the Southern hemisphere using the Curtis Schmidt and 0.9-m telescopes:
More recently, Brian Pohl, a masters student at the Univ. of North Carolia has been observing lots of RRL stars in the southern hemisphere using the PROMPT observatory.
We have also been studying variable stars in a number of globular star clusters in the Milky Way galaxy.
II. Distances
Upon reading an introductory astronomy textbook, it may seem that astronomers are obsessed with measuring the distances to celestial objects. There is good reason for this. Measuring accurate distances is the key to discovering the physical nature of celestial objects. For example:
Since we can't use a yardstick to measure celestial distances directly, astronomers have devised a number of distance-measuring tricks. Most textbooks describe the use of stars called "standard candles". Certain types of stars have known luminosities -- if we find one such star in the sky and measure its apparent brightness, we can determine its distance using the distance-luminosity formula
where b is the apparent brightness, L is the luminosity, and d is the distance.
A common example of a standard candle is a Cepheid variable. These stars pulsate -- actually grow larger and smaller in radius over the course of time. As they do, they get brighter and fainter. One can detect this brightness variability and thus identify a Cepheid from the many non-variable stars in the sky. By monitoring the star's brightness changes over time, one can determine the average apparent brightness, and combine it with the standard Cepheid luminosity to determine the distance to the Cepheid.
RR Lyrae stars are a similar type of pulsating variable. RR Lyrae (for simplicity, RRL) are smaller and less luminous than Cepheids. Cepheids form in the red giant phases of some massive stars, and thus only occur in young groups of stars, while RRL form in the red giant phases of some low-mass stars, and thus only occur in old groups of stars like globular clusters and the Galactic Center. The BGSU Variable Star Project is currently focusing on RRL and their use as standard candles for these old populations.
III. Interstellar Dust
 Measuring
celestial distances would be fairly routine if it were not for one
big monkey-wrench that Nature has thrown into the works. The space
between the stars is filled with gas and dust: the interstellar
medium. The dust is small particles of carbon and other elements,
similar to soot particles. Like smoke from a sooty fire, these
particles absorb light. Thus, some fraction of the light from a
distant star gets absorbed, or scattered onto a different path, on its journey to us. The dust scatters/absorbs
blue light more effectively than it does red light, so the star
appears to us both fainter and redder than the star actually
is. The amount of "interstellar absorption" and "interstellar reddening" depends on the amount of
dust between us and the star -- the more dust, the more absorption
and reddening.
Measuring
celestial distances would be fairly routine if it were not for one
big monkey-wrench that Nature has thrown into the works. The space
between the stars is filled with gas and dust: the interstellar
medium. The dust is small particles of carbon and other elements,
similar to soot particles. Like smoke from a sooty fire, these
particles absorb light. Thus, some fraction of the light from a
distant star gets absorbed, or scattered onto a different path, on its journey to us. The dust scatters/absorbs
blue light more effectively than it does red light, so the star
appears to us both fainter and redder than the star actually
is. The amount of "interstellar absorption" and "interstellar reddening" depends on the amount of
dust between us and the star -- the more dust, the more absorption
and reddening.
If light is absorbed by interstellar dust, it means the apparent brightness we measure is fainter than it should be, and we make an error in measuring the distance to the star (we estimate it to be farther away than it really is). So, to measure correct distances, we need to also measure the amount of interstellar absorbtion. The problem is, it can be difficult determining how much dust is present. To paraphrase Walter Baade, "If I had known about interstellar dust, I wouldn't have become and astronomer."
 As
with measuring celestial distances, astronomers have come up with
some tricks for estimating the amount of interstellar dust. Since
dust and gas tend to exist together in the interstellar medium, and
since hydrogen gas can be detected using radio telescopes, Burstein
and Heiles (1982) were able to map the amount of hydrogen and
hence dust over much of the sky. More recently, Schlegel
et al. (1998) used microwave data from the COBE
satellite to measure directly the amount of interstellar dust
over much of the sky (dust warms up as it absorbs starlight, and
re-emits the energy in the infrared and microwave region of the
spectrum).
As
with measuring celestial distances, astronomers have come up with
some tricks for estimating the amount of interstellar dust. Since
dust and gas tend to exist together in the interstellar medium, and
since hydrogen gas can be detected using radio telescopes, Burstein
and Heiles (1982) were able to map the amount of hydrogen and
hence dust over much of the sky. More recently, Schlegel
et al. (1998) used microwave data from the COBE
satellite to measure directly the amount of interstellar dust
over much of the sky (dust warms up as it absorbs starlight, and
re-emits the energy in the infrared and microwave region of the
spectrum).
 These
maps do a good job of estimating the amount of dust far from the
Galactic Plane. However, within about 10-20 degrees of the plane, the
amount of dust gets large, and it varies rapidly from one place to
another (for example, two sight-lines only arcseconds apart on the
sky might have significantly different amounts of dust). Near the
plane, we need techniques that measure the reddening and absorption
directly from the stars we are interested in studying.
These
maps do a good job of estimating the amount of dust far from the
Galactic Plane. However, within about 10-20 degrees of the plane, the
amount of dust gets large, and it varies rapidly from one place to
another (for example, two sight-lines only arcseconds apart on the
sky might have significantly different amounts of dust). Near the
plane, we need techniques that measure the reddening and absorption
directly from the stars we are interested in studying.
Some decades ago, Conrad Sturch (1966) noticed that all RRL far from the plane have roughly the same (B-V) color, after one makes minor corrections for the metal-abundance and pulsation periods of the individual stars. By measuring the apparent (B-V) color of an RRL near the plane and comparing it to the un-reddened (or "intrinsic") color of stars far from the plane, he was able to measure the reddening (and thus absorption) due to dust along the line of site to the star. Victor Blanco (1992) refined this method. Mario Mateo et al. (1995) suggested that (V-I) colors might be better suited to measuring reddening tools since they should be less affected by metal-abundance differences from one RRL to the next.
IV. The BGSU/CTIO RR Lyrae Project
 The
Sturch/Blanco relationship between (B-V) color, metallicity,
and period is based on a large number of stars, and is well
established (see panel (a) of this plot).
By comparison, Mateo's suggestion was based on (V-I) colors of
only 11 RRL compiled from the literature (see panel (b)). The
goal of our project is to test Mateo's suggestion by adding many more
stars to the plot in panel (b). Hopefully, they will define a
relationship between (V-I) color, metallicity, and period that
is at least as tight as for (B-V) color.
The
Sturch/Blanco relationship between (B-V) color, metallicity,
and period is based on a large number of stars, and is well
established (see panel (a) of this plot).
By comparison, Mateo's suggestion was based on (V-I) colors of
only 11 RRL compiled from the literature (see panel (b)). The
goal of our project is to test Mateo's suggestion by adding many more
stars to the plot in panel (b). Hopefully, they will define a
relationship between (V-I) color, metallicity, and period that
is at least as tight as for (B-V) color.
To do this, we must first measure the (V-I) colors of many un-reddened RRL far from the Galactic Plane. We will observe (V-I) colors for 40 or so stars. We have selected RRL that span a wide range in metal-abundance and period so that we can characterize any dependence of intrinsic color on these parameters [e.g., color = f(metallicity, period)].
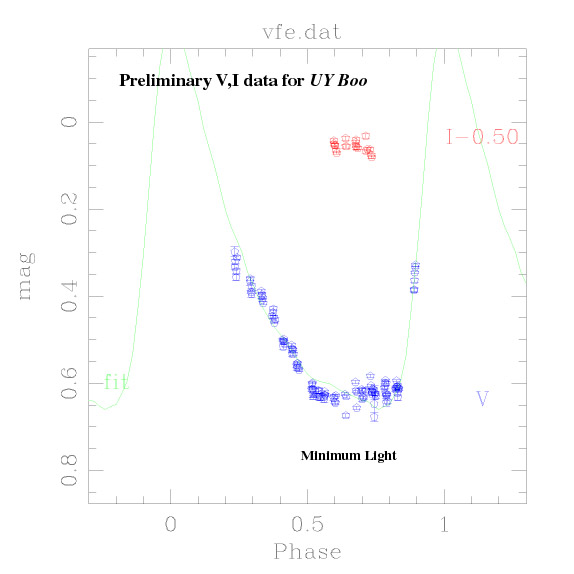
As of August 2012, nearly two dozen BGSU students have obtained and reduced images of over three dozen RRL. UY Boo, BK Dra and AV Peg are nice examples. We are continuing to compile data on these stars and will add new stars to the progam as new students join the team. Don Hoard and the CTIO REU students contributed BVI light curves of seven Southern RRL during an observing run in Jan/Feb 2001 with the Michigan's Curtis Schmidt at CTIO, resulting in a paper in PASP. Soon after, Alan Whiting and students gathered more data in Jan 2002 with the 0.9-m at CTIO that produced another PASP paper. We obtain differential photometry (measure the difference between the variable star's magnitude and other, constant "comparison stars" on the same CCD image) at BGSU, and have been calibrating the magnitudes of the comparison stars during photometric nights at the WIYN 0.9-m telescope on Kitt Peak.
 The
observations made at BGSU are performed using our 0.5-meter
diameter reflecting telescope on top of
the Physical Sciences Lab Building. We have an electronic CCD camera
and filter wheel which are operated by a PC located in the warmroom
adjacent to the dome. The observer opens the dome and prepares the
telescope, then retires to the warmroom. The observer consults a
schedule that indicates which RR Lyrae star to observe at what time,
choses a star to observe, and types the coordinates into the
telescope control computer. The computer then slews the telescope to
that point in the sky. The observer commands the camera to take
several pictures and to change filters using a simple menu-driven
program called CCDSoft. The pictures are recorded on the PC's hard
drive. It takes about 15 minutes to complete the observations for a
star, after which the observer selects a new star and repeats the
procedure. During the summer, observers will work for most or all of
a 6-8 hour night. During the academic year, observing nights of 4 or
more hours are recomended. A CD/cassette/radio player is provided for
entertainment.
The
observations made at BGSU are performed using our 0.5-meter
diameter reflecting telescope on top of
the Physical Sciences Lab Building. We have an electronic CCD camera
and filter wheel which are operated by a PC located in the warmroom
adjacent to the dome. The observer opens the dome and prepares the
telescope, then retires to the warmroom. The observer consults a
schedule that indicates which RR Lyrae star to observe at what time,
choses a star to observe, and types the coordinates into the
telescope control computer. The computer then slews the telescope to
that point in the sky. The observer commands the camera to take
several pictures and to change filters using a simple menu-driven
program called CCDSoft. The pictures are recorded on the PC's hard
drive. It takes about 15 minutes to complete the observations for a
star, after which the observer selects a new star and repeats the
procedure. During the summer, observers will work for most or all of
a 6-8 hour night. During the academic year, observing nights of 4 or
more hours are recomended. A CD/cassette/radio player is provided for
entertainment.
Later, the observer or another student will transfer all the pictures taken on one night to a Sun workstation, where the images will be processed to remove certain defects. Students perform the processing steps by following a procedure page on the web and in consultation with Andy. The data reduction culminates with the student measuring on each picture the magnitude (brightness) of the RR Lyrae star along with the magnitudes of several comparison stars on the frame. Programs compute the magnitude difference (RR Lyrae - comparison), add a time-tag to the observation, and write the information to a database.
As the database grows, students will analyze the data for each star to determine the pulsation period of the star (the time between successive brightness peaks) and to derive a light curve (V and I magnitude graphed as a function of time). When a star has been observed enough to determine an accurate color measurement, it will be removed from the program and replaced with a new star. We hope to observe every clear night each summer (May through August) and as much as possible throughout the academic year. Students will be co-authors on the final paper that will be submitted to a professional astronomical journal, and are encouraged to help write the paper.
If you have any questions about this material, please contact Andy.
V. Applications of the RRL Reddening Method
Once we have established the intrinsic (V-I) color of RRL, and any metal-abundance and period dependence it may have, we and other astronomers can use the relationship to measure the absorption and reddenings of interesting objects in high-reddening regions. Here are a few examples;
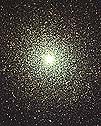 Globular
clusters are old groups of stars. Many of them contain RRL, and many
are located near the Plane. Observers take images of a cluster over
the course of many nights, and determine the brightness and color
changes of any RRL. They determine the average (V-I) color of
each variable, and compare it to the intrinsic (V-I) of RRL
from our Project. The differences give the reddening of each RRL in
the cluster. This can be used to correct the apparent brightness of
the cluster RRL for interstellar absorption, and thus determine the
correct distance to the cluster. Once the distance to the cluster is
known, we can determine the age of the cluster from the luminosity of
the stars at the main sequence turn-off. In particular, ages of
globulars
near the Galactic Center and near the disk are important, since
they help us understand how the Galaxy formed. If the globulars near
the Center are relatively old, it suggests the first episodes of star
formation in our Galaxy occurred in this dense, central region.
Studying the ages of globulars near the disk may help us understand
how the disk formed -- gradually from the contracting halo, or
rapidly from the "puffing up" effect of a gravitational interaction
with another galaxy.
Globular
clusters are old groups of stars. Many of them contain RRL, and many
are located near the Plane. Observers take images of a cluster over
the course of many nights, and determine the brightness and color
changes of any RRL. They determine the average (V-I) color of
each variable, and compare it to the intrinsic (V-I) of RRL
from our Project. The differences give the reddening of each RRL in
the cluster. This can be used to correct the apparent brightness of
the cluster RRL for interstellar absorption, and thus determine the
correct distance to the cluster. Once the distance to the cluster is
known, we can determine the age of the cluster from the luminosity of
the stars at the main sequence turn-off. In particular, ages of
globulars
near the Galactic Center and near the disk are important, since
they help us understand how the Galaxy formed. If the globulars near
the Center are relatively old, it suggests the first episodes of star
formation in our Galaxy occurred in this dense, central region.
Studying the ages of globulars near the disk may help us understand
how the disk formed -- gradually from the contracting halo, or
rapidly from the "puffing up" effect of a gravitational interaction
with another galaxy.
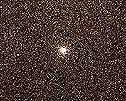 Many
RRL exist outside of clusters near the center of the Galaxy. Here,
the reddening is large and varies greatly from one point to another.
Accurate reddenings must be determined for each star we are
interested in, using the our RRL reddening method. This will help us
measure more accurately the distance to the center of our Galaxy, and
thus the size and scale of our Galaxy.
Many
RRL exist outside of clusters near the center of the Galaxy. Here,
the reddening is large and varies greatly from one point to another.
Accurate reddenings must be determined for each star we are
interested in, using the our RRL reddening method. This will help us
measure more accurately the distance to the center of our Galaxy, and
thus the size and scale of our Galaxy.
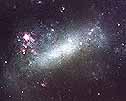 Many
RRL exist in nearby galaxies. A few of these galaxies lie near the
plane of our Galaxy, behind the curtain of dust in our our Galaxy.
Here, the Schlegel et al. (1998) reddening maps give poor reddening
estimates. Many of the galaxies also have significant amounts of
gas
and dust of their own, so their RRL are also subject to "internal
reddening". Our method will measure the combined reddening produced
by dust in our Galaxy and from dust in the distant galaxy itself.
Determining distances to nearby galaxies will help us refine the size
of the Local Group of galaxies and help us learn the sizes and other
properties (radius, mass, age, etc) of these galaxies.
Many
RRL exist in nearby galaxies. A few of these galaxies lie near the
plane of our Galaxy, behind the curtain of dust in our our Galaxy.
Here, the Schlegel et al. (1998) reddening maps give poor reddening
estimates. Many of the galaxies also have significant amounts of
gas
and dust of their own, so their RRL are also subject to "internal
reddening". Our method will measure the combined reddening produced
by dust in our Galaxy and from dust in the distant galaxy itself.
Determining distances to nearby galaxies will help us refine the size
of the Local Group of galaxies and help us learn the sizes and other
properties (radius, mass, age, etc) of these galaxies.
This project was supported by grants from the National
Science Foundation![]() and NASA
and NASA![]() .
.